Multi-agent AI debugging is broken. We built a replay system to fix it.
Multi-agent AI orchestrations are concurrent by design. Six, ten, thirty agents working in parallel, emitting events, reacting to each other, finishing in non-deterministic order. When one of them goes sideways and drags the whole run with it, the traditional observability stack — structured logs, metrics, traces — falls flat. Logs are a scoreboard. They tell you what happened. They don't show you the moment it happened, the information the agent had when it decided, the way the system looked from inside one second before it broke.
You can grep a JSONL audit log. You can grep harder. You can write a script that filters by agent id and time window. By the time you've reconstructed enough state to understand the failure, it's been an hour and you still aren't sure you read it right.
What we wanted: a replay. Scrubbable, share-able, visual. Pause at any moment, look at every event that fired in the last 60 seconds, see which agent did what to which other agent. Like watching a match back, not like reading a stack trace.
So we built one. It's called kaleidoskop. Drop any Mozaik audit log on the page, watch the orchestration play back as a hexagonal honeycomb of agents firing through a shared event bus. Free, open-source, runs in your browser.
Why this is possible at all: Mozaik
The reason kaleidoskop can replay any orchestration is the framework underneath it. Mozaik is the TypeScript framework we build on. Its central abstraction is an AgenticEnvironment — a shared event bus that every participant joins. Humans, agents, observers, and tools stream typed SemanticEvent items into the environment; everyone subscribed to that event type gets it. There's no central scheduler, no rigid pipeline. Behaviours compose by reaction.
That architecture pays observability dividends almost accidentally. Every interaction in the system is already an event on a shared bus. The audit log is just a serialisation of that bus — one JSONL line per SemanticEvent, with timestamps, source, and structured payload. Nothing is hidden inside an agent's private loop. Nothing happens that the bus doesn't see.
Frameworks that put agents in private async functions with hand-rolled coordination glue can't do this. To reconstruct what happened between agents, you need to instrument every call site and unify the formats. Mozaik gets it for free because the bus IS the coordination layer. Observability is in the architecture, not bolted on.
What kaleidoskop actually does
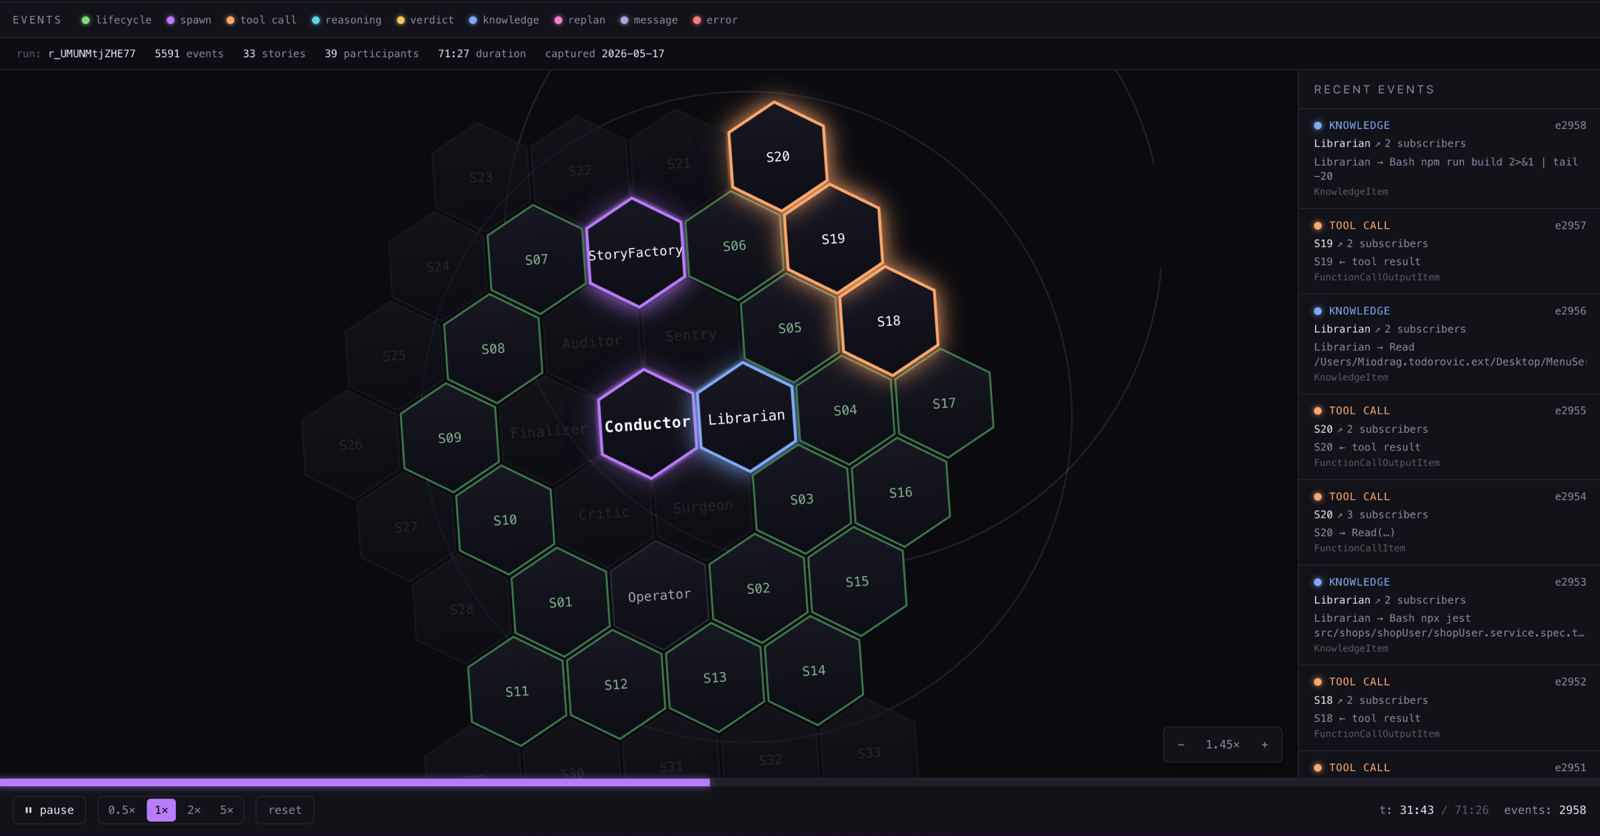
The replay engine parses a JSONL audit log into a sequence of typed events, then walks that sequence at a configurable speed (default 10×), streaming events to the browser over a WebSocket. The frontend renders participants as hexagons in a concentric honeycomb — ring 0 is the Conductor, ring 1 is the observers (Critic, Surgeon, Librarian, Sentry, Auditor, Finalizer), ring 2 starts the Operator, StoryFactory, and the first ten story agents, ring 3 and 4 absorb additional stories for larger runs.
Every bus event ripples outward from its emitter, hits the subscriber hexes, and pulses them in the event-type colour. The palette is the same nine buckets the legend shows: green for lifecycle, purple for spawn, orange for tool calls, cyan for streaming reasoning, yellow for verdicts, blue for knowledge, pink for replans, lavender for messages, red for errors. Reading a replay becomes pattern-recognition: a tight cluster of orange on one story means a long tool-call sequence, an unanswered purple spawn means StoryFactory dropped one, a red flash near the end means the Critic failed something.
Two architectural details from the engine worth surfacing:
Subscriber reconstruction. Audit logs don't carry per-event subscriber lists — they weren't designed to. kaleidoskop rebuilds the fan-out by indexing each event's domain against a static SUBSCRIBERS matrix sourced from Mozaik's own CORE.md / OBSERVERS.md spec. A FunctionCall event always fans out to Librarian + Sentry + Auditor; a StoryResult to Surgeon + Conductor + Finalizer + Auditor; etc. Same matrix the live framework uses, applied retroactively at parse time, so the visual fan-out matches the actual runtime behaviour. Single source of truth, shared between the demo on the landing page and the live replay.
Snapshot-on-seek. When you scrub the progress bar to t=89s, the backend doesn't re-play the events at high speed and ask the frontend to catch up — it walks the events list to the target, accumulates the lifecycle state (which agents are completed, which are still running, what the recent-events window looks like), and sends a typed {kind: "snapshot"} envelope. The frontend wholesale-replaces its state, clears transient visuals, then resumes streaming live events from the new cursor. Instant scrub, no lag, lifecycle stays consistent.
Try it
Below is a real Mozaik scripted demo playing on this very page. The full live tool is at kaleidoskop.jigjoy.ai — drop any ~/.baro/runs/*.jsonl, scrub through it, share the link. Anyone with the link sees the same replay.
What this means for baro
baro is our CLI orchestrator built on top of Mozaik — you give it a goal in one prompt, it plans the work as a parallel DAG of AI coding agents, runs them concurrently, has them critique each other's diffs, repairs the broken ones, and ships a pull request. Because baro is Mozaik-native, every run emits a complete audit log to ~/.baro/runs/. Every run is replayable in kaleidoskop. Out of the box. No instrumentation, no tracing setup, no separate logging pipeline.
The visibility transforms what it feels like to trust baro on real work. The screenshot below is a real baro run we shipped recently: a 33-story plan, 5591 bus events, a 71-minute wall-clock across two sessions (the first ran out of Anthropic usage cap mid-flight; the second picked up from S21). The raw JSONL is 7.5 MB. Reading it linearly would take hours. Watching it back in kaleidoskop, you find the stall, the Critic rejection, and the Surgeon repair in a couple of minutes.
That's the architectural payoff: building on Mozaik means every tool you build downstream gets observability as a free side effect.
This is the foundation, not the destination
The hex grid is the entry point. Watching events ripple through the bus is enough to find where a run broke — but the real value lands one step further: an analytical view that tells you what the agents were actually doing, and lets you ask what they would have done differently.
Two capabilities are already coming together because the Mozaik bus makes them nearly free.
Pluggable observers. A Mozaik observer is just an object that subscribes to AgenticEnvironment events. The replay engine instantiates one fresh environment per session. Drop in a new observer — token-usage analyzer, story-clustering miner, prompt-drift detector, anything you'd write for a live Mozaik run — and the replay backend feeds it the recorded events as if they were happening live. Same interface as production. Different intent. We use this internally to grade Critic verdicts after the fact and to find pathological tool-call sequences; you can write a new one in twenty lines.
Selective live replay. The bigger one. Replay the recorded run mostly as-is, but pick one agent — say, the Critic — and let it actually call its LLM again, with a modified prompt or a different model. Every other agent is mocked from the original Mozaik events and produces the same outputs it did the first time. The Critic runs live against the same upstream coordination, reads the same context, but responds with a fresh inference. You get a side-by-side: the original outcome vs the one your new prompt produces, against an identical run history.
That's the debugger we actually want. Not "look at what happened" — "re-do the past with one decision changed and see how far the change propagates". The audit log becomes a frozen environment you can A/B against. Prompt engineering on multi-agent systems stops being guesswork with throwaway runs and becomes targeted: change one prompt, replay through the same coordination, measure the difference.
Mozaik makes this nearly free because the bus abstracts the "who's live, who's replayed" question down to "which source is producing events vs replaying them". Swap one source from "log" to "live LLM" and everything downstream keeps working. The same property that makes Mozaik orchestrations trivially replayable is the property that makes them trivially mutable for analysis.
Open source, free to use
kaleidoskop is open on GitHub — TypeScript + React frontend, Fastify backend, single EC2 + S3 deploy, scripts in docs/DEPLOY.md. The hosted instance at kaleidoskop.jigjoy.ai will render any Mozaik run you drop on it; self-host walks through the README.
One last thing
The idea for an agent replay system didn't come from observability prior art — it came from twenty years of watching game replays. A separate post on that is coming. If you want the backstory before it's written, find me on Twitter or in the JigJoy Discord — happy to talk about it.

Different is better than better.
