How baro generated 808 NestJS Jest tests autonomously in 71 minutes

I had been wanting to throw the hardest mechanical-but-not-trivial task I could think of at baro for a while: full Jest unit coverage for a real NestJS service. Not a toy. Every service, controller, guard, listener, scheduler, mapper, decorator, filter, helper, and Zod schema under src/. With shared test infra written from zero, because the repo had none. And one final phase to run the suite, validate quality, and file a GitHub issue for any test that fails because of a real production bug, not because the test was sloppy.
The repo is a private NestJS + TypeORM service backing a multi-shop restaurant-ordering product — shops, menus, promotions, tables, table sessions, role-based access, the lot. About 30 source modules touching every layer. The kind of thing I would have spent a couple of weeks unit-testing by hand if anyone had ever scheduled it.
I typed the goal in one go, hit enter, watched baro plan, then went to do something else.
Eleven hours later — most of which I spent asleep, because Anthropic capped me at 3am and the world's most polite "go to bed" pop-up is the one that says you're out of extra usage until the next reset — there was a pull request on the branch with 808 passing tests across 64 spec suites, 83.5% branch coverage, +13,606 lines of test code, and zero filed bug issues. The last number is the one I keep thinking about.
The plan baro built
baro's Architect read the codebase first, then the Planner decomposed the goal into 33 stories laid out in seven groups:
- L0 (1, blocking) —
src/test-utils/: repository / queryBuilder / dataSource / configService / eventEmitter mocks plus entity builders for all 8 entities. Nothing else can start until this lands. - L1 (8) — helpers, HttpException filter, the four custom decorators, four mapper groups, the Zod env schema.
- L2 (5) — every guard against a mocked
ExecutionContext. - L3 (10) — services, the event listener, the cron scheduler. Coverage bar set per spec: every public method × happy / negative / edge, every branch reached, every
throw, every error-message constant asserted, everyhandleDbErrorbranch. - L4 (7) — controllers, checking forwarding, guard metadata, DTO wiring.
- L5 (1) — class-validator decorator tables for all DTOs across the modules.
- L6 (1, last) — runs
npm run test:cov, validates suite quality (noexpect(true).toBe(true), no real DB / network, no@ts-ignore, noit.only), gates on ≥85% branch coverage, and for every legit failing test files agh issue createwith file / line, expected-vs-actual, repro, and the failing assertion.
Those L1…L5 labels are organizational, not dependency-level. In the actual DAG, every story between L0 and L6 is independent. The dependency graph looks like this:
L0 (1) → { 31 stories, all in parallel } → L6 (1)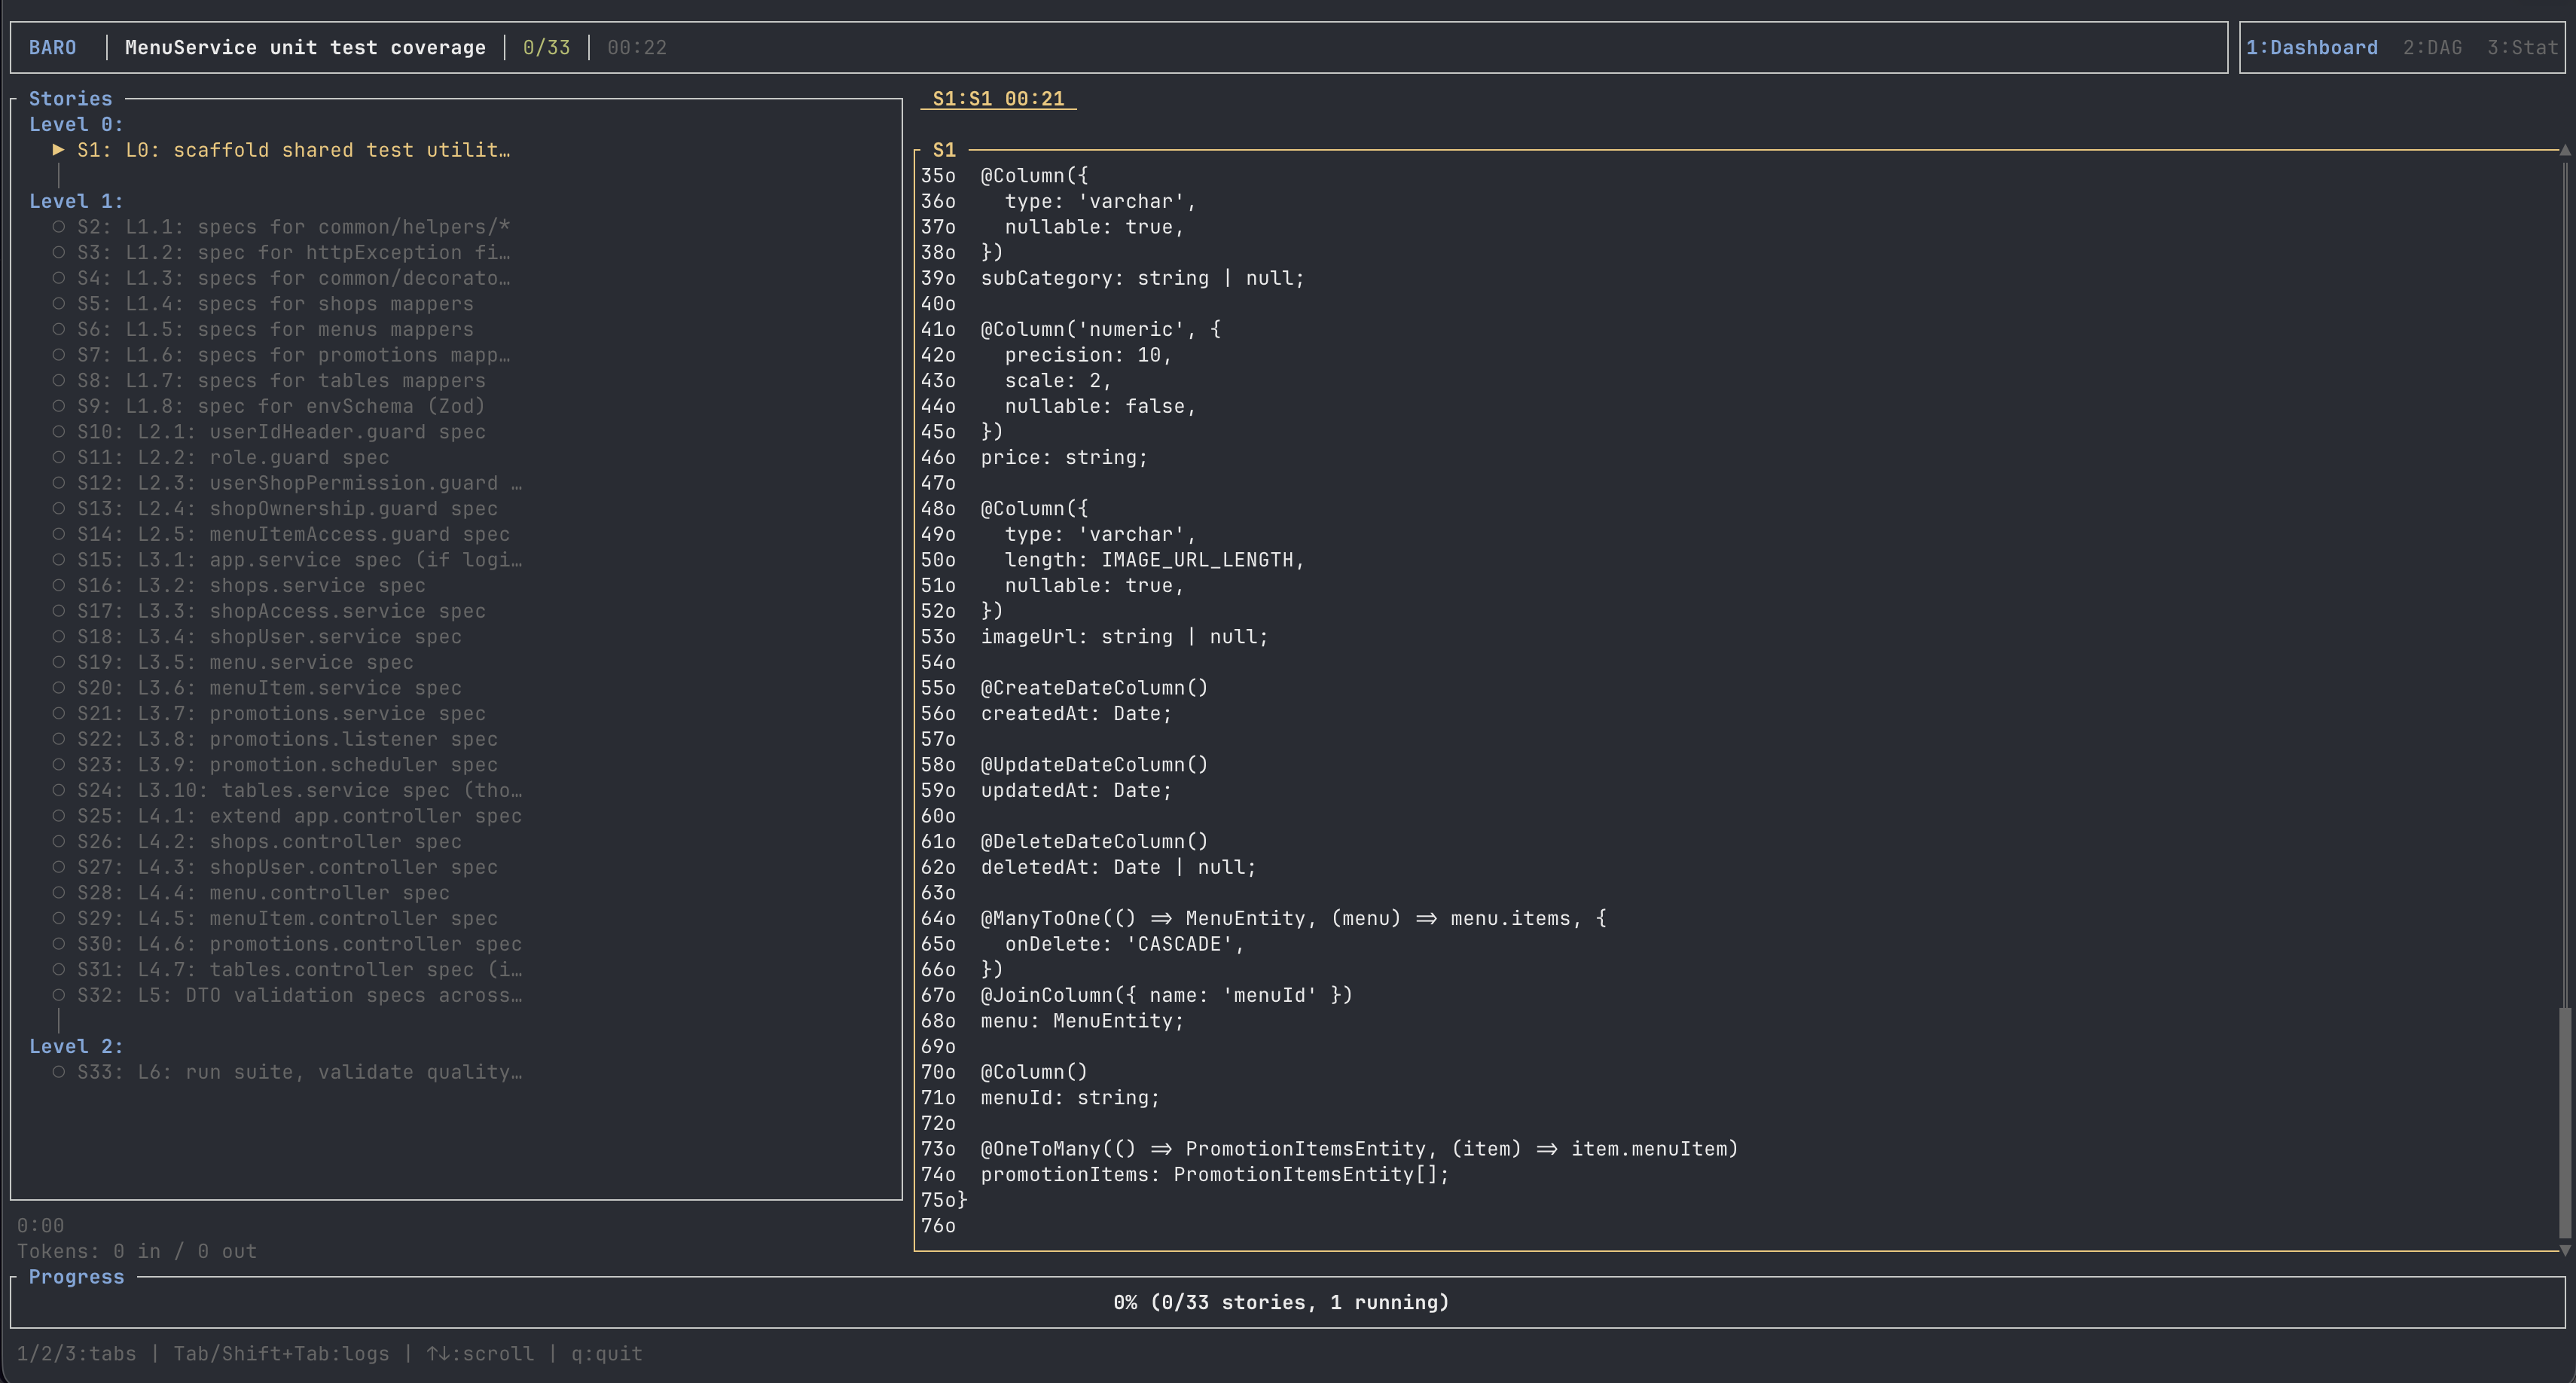
Why I ran --parallel 3
In principle, with 31 truly parallel stories, you'd just set --parallel 31 and watch the whole thing land in roughly the time of the slowest story. That's not how the Anthropic billing surface actually works on a consumer plan. I'm on the 5× plan, and 31 concurrent Claude sessions reading the same project context would have ploughed through the daily usage allowance in maybe ten minutes flat.
So I ran --parallel 3 as the conservative call. Three concurrent stories at any time, baro's scheduler feeds the next one in as soon as a slot frees up. I expected this to finish inside an hour with margin.
3am: out of usage
22 stories in, with the rest of L3 and all of L4 / L5 / L6 still queued, this happened:
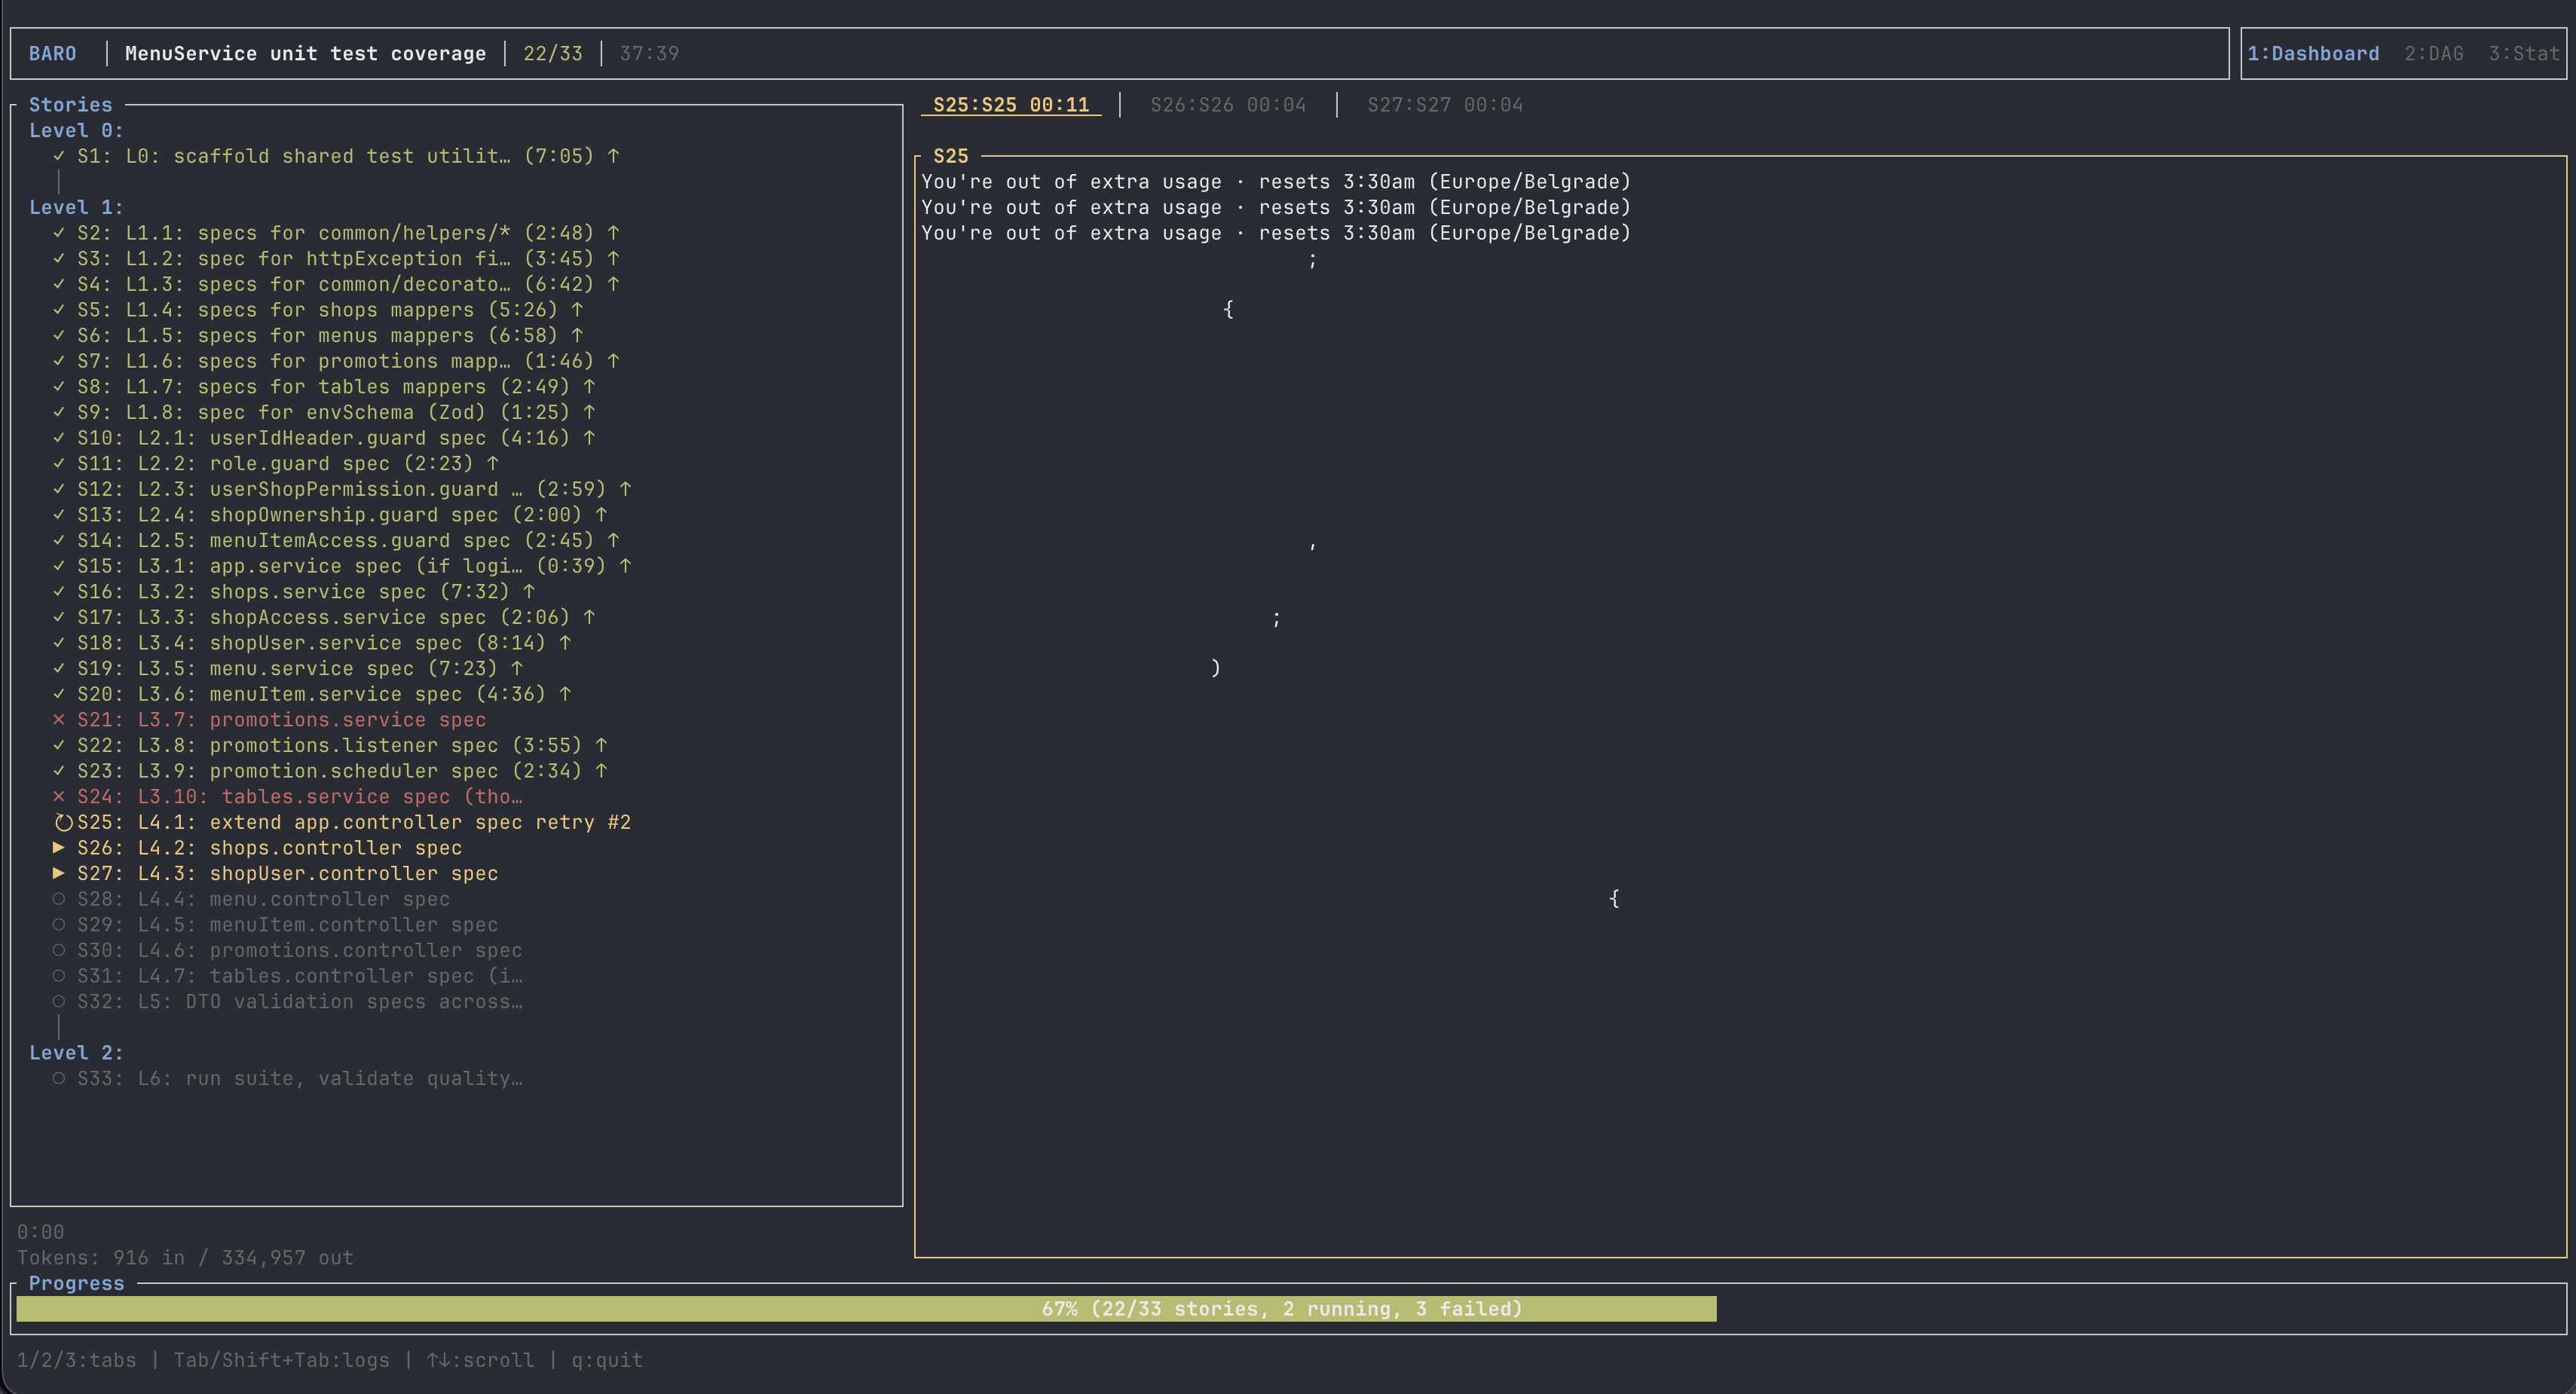
Six in-flight story agents got the same response from the Claude Code subprocess at almost the same moment: You're out of extra usage. Resets 3:30am Europe/Belgrade. Each one failed with claude reported isError on result:success — a slightly mangled error label that I'm going to tighten in the next baro release, because it should obviously read Anthropic usage limit reached.
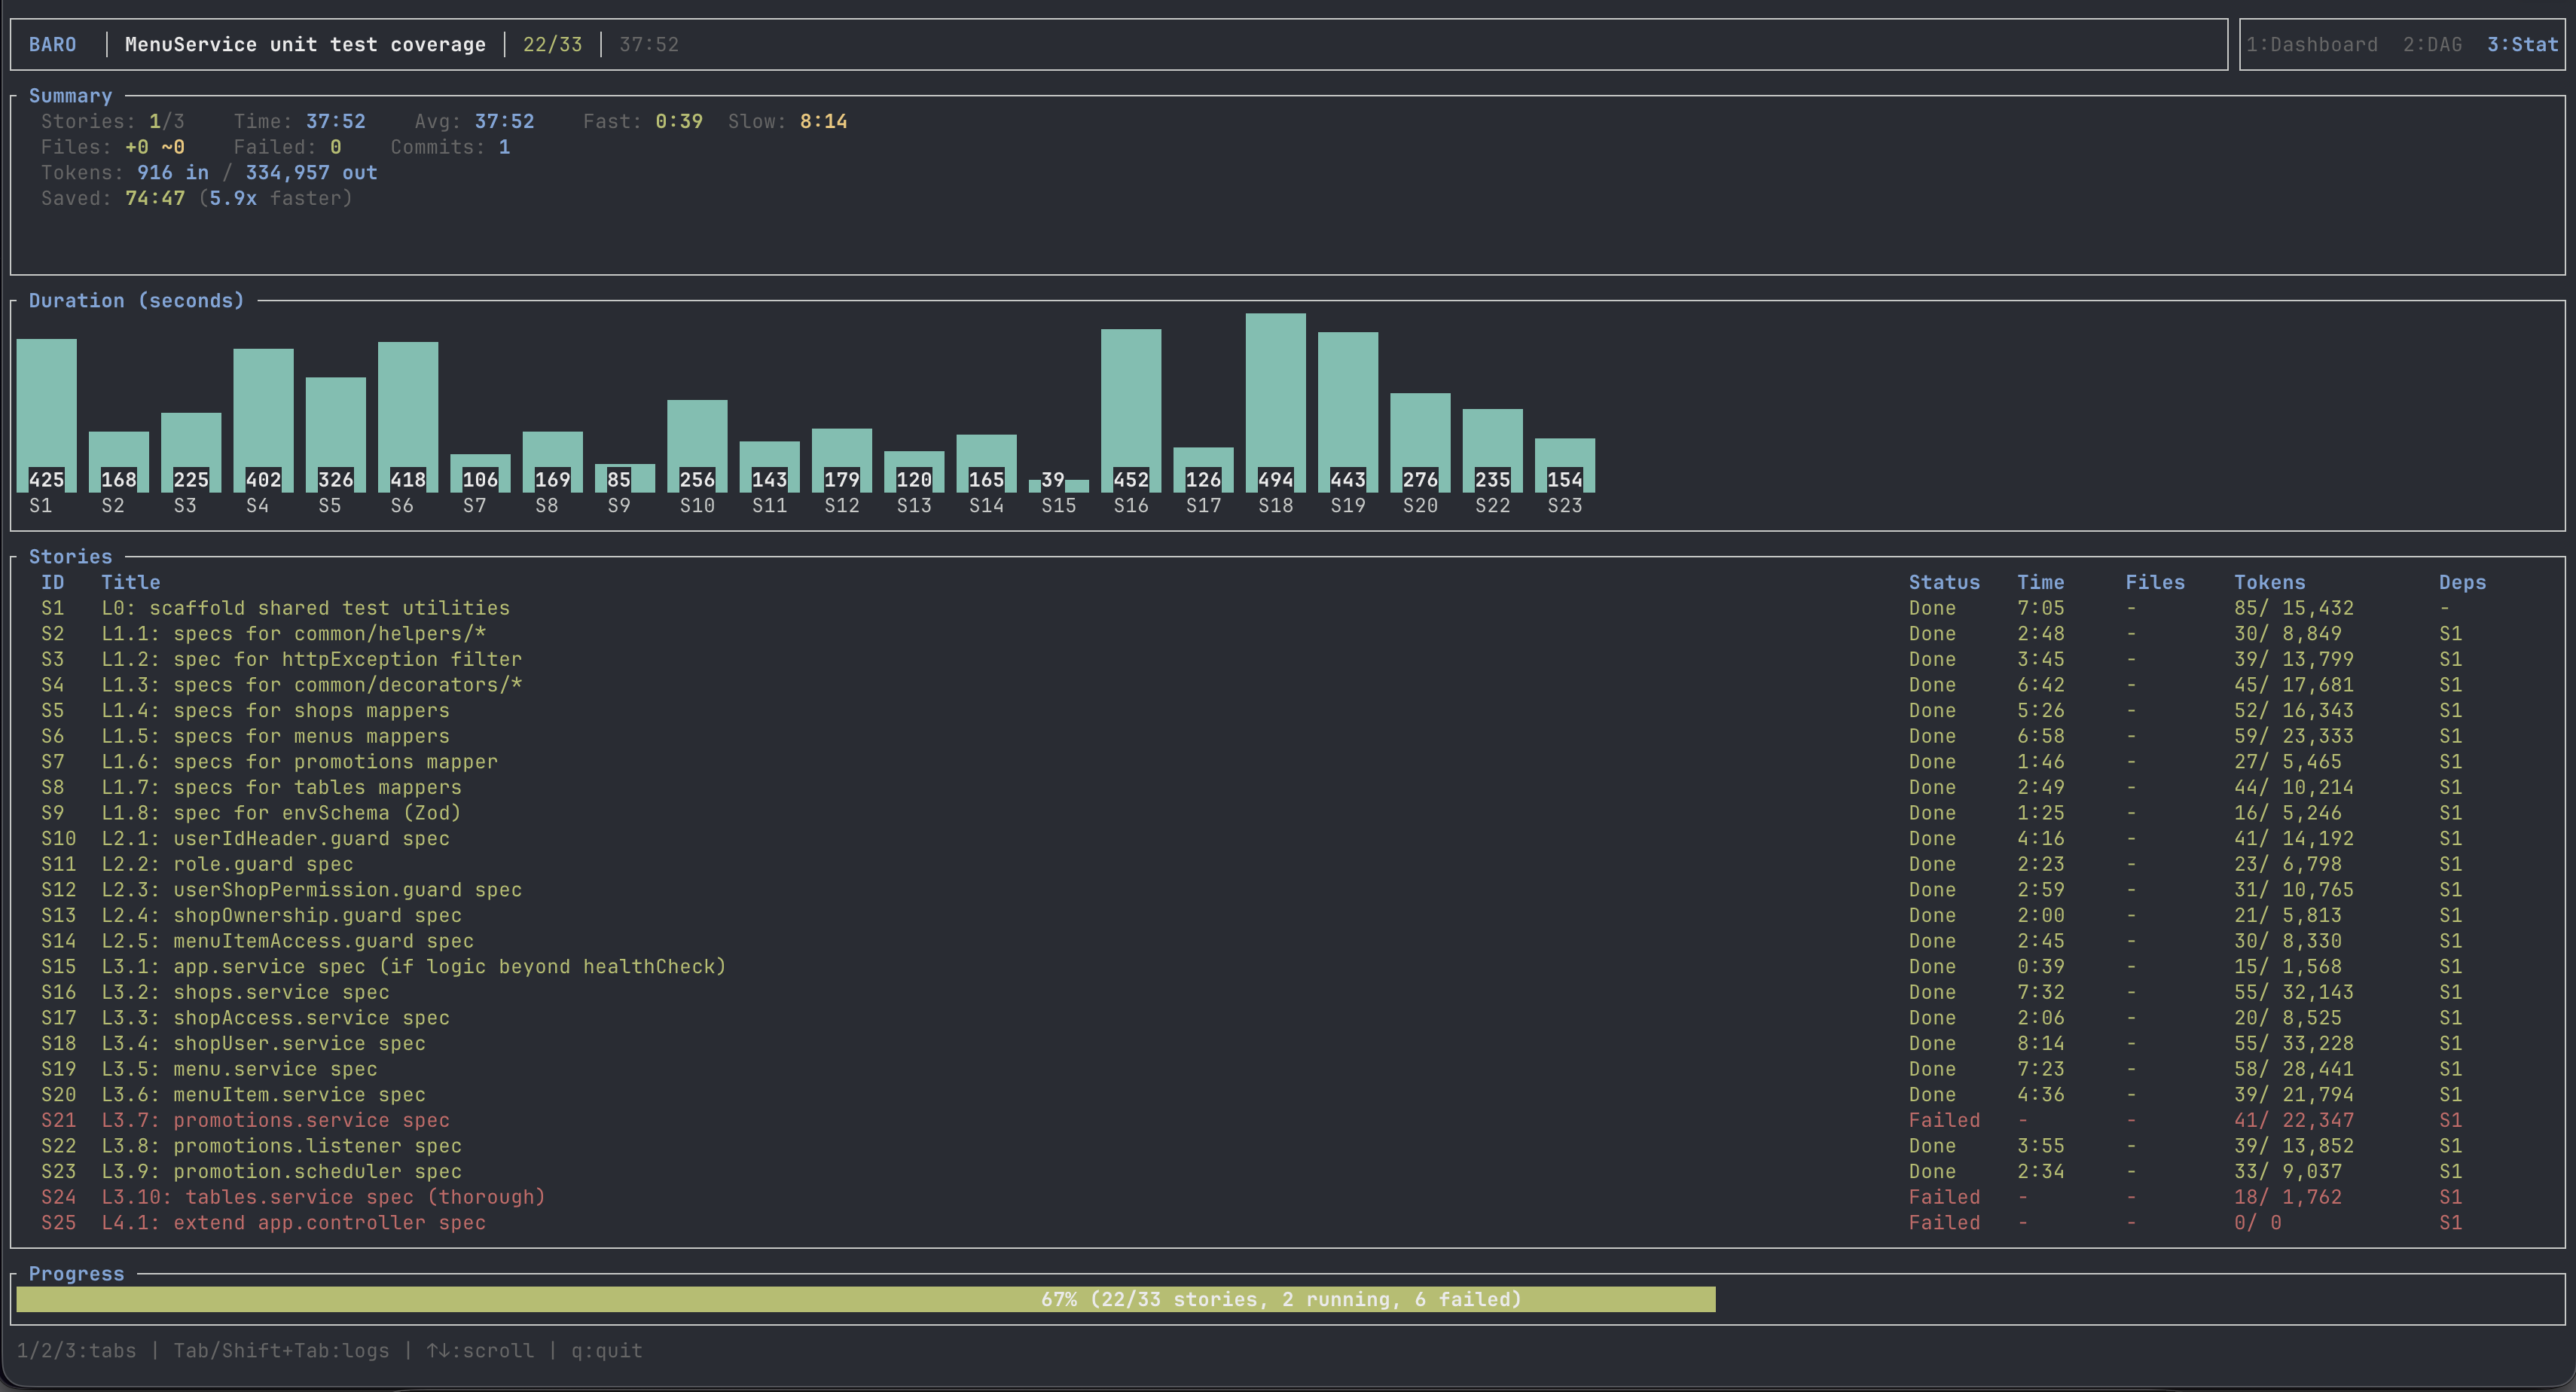
baro's Conductor halted the run gracefully. 22 stories completed, committed onto the branch. 11 stories left. Session-1 wall time: 37:32.
I closed the laptop. Slept on it.
Morning: resume
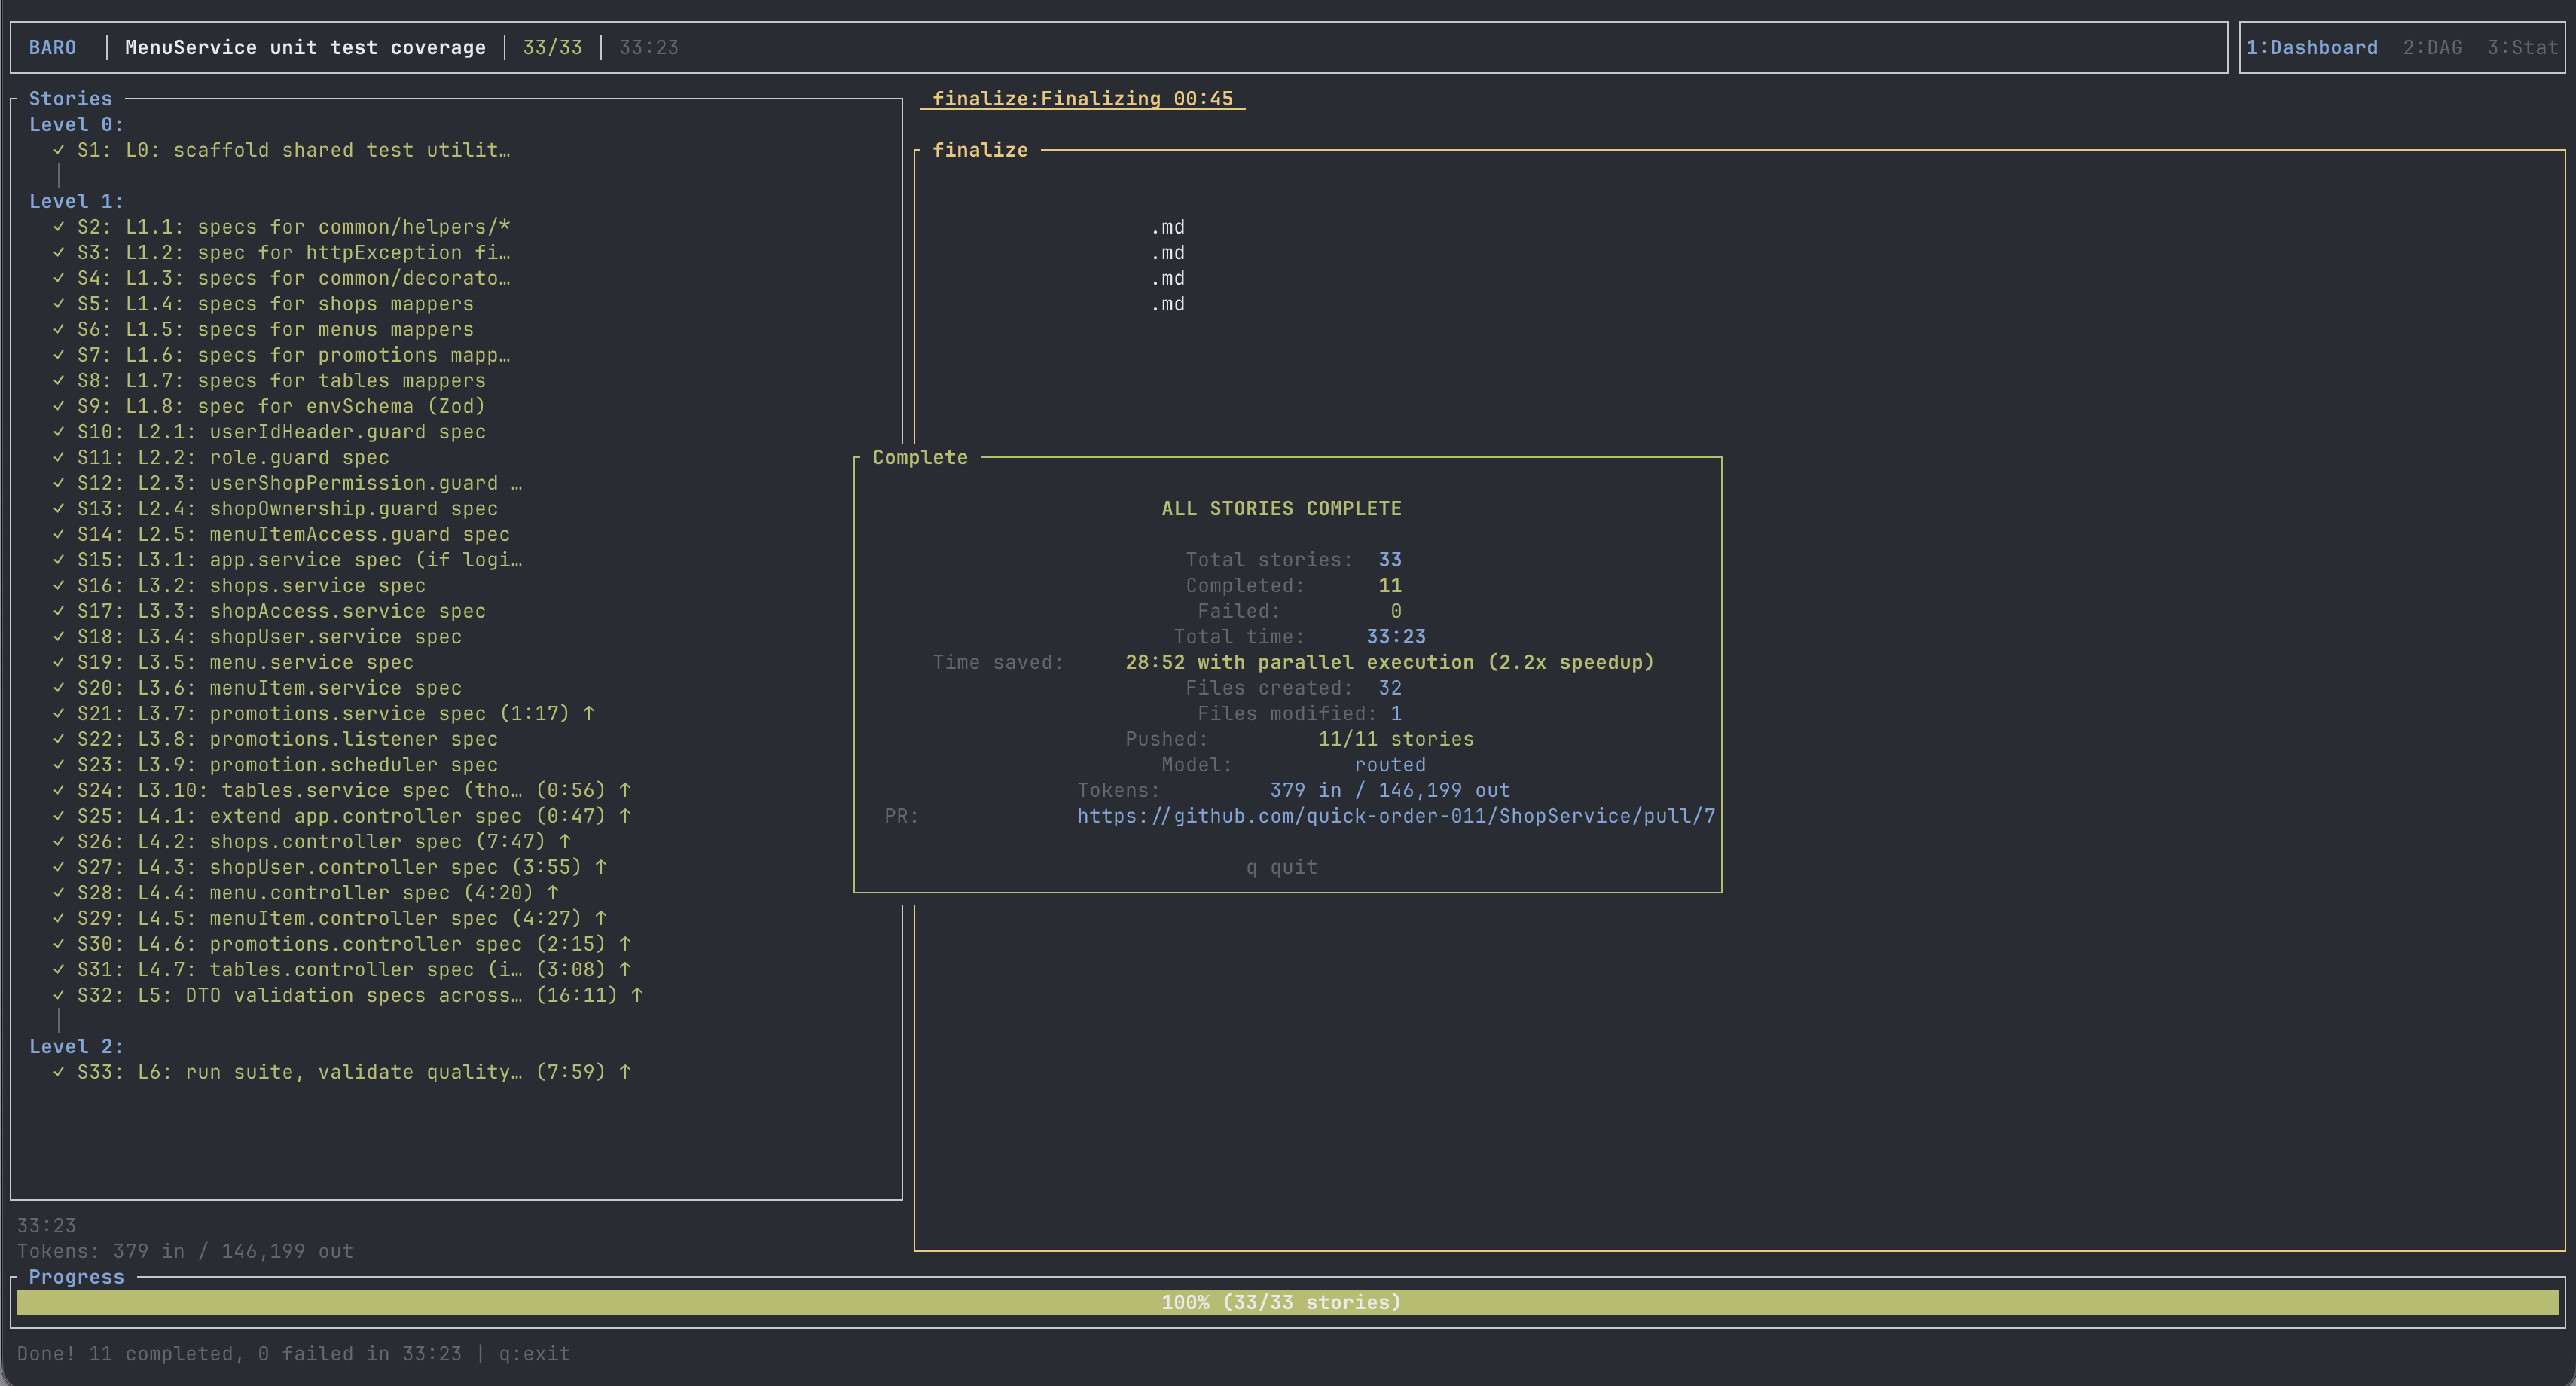
At 09:50 the next morning I ran baro on the same branch with the same goal. baro noticed the existing branch state, asked the Planner for a fresh DAG against what was missing in src/**, and produced an 11-story DAG covering exactly the work that hadn't landed: the controller specs, the L5 DTO sweep, and the L6 quality phase.
No manual stitching. I never told baro which stories had failed. The branch was the source of truth: the missing spec files told it everything it needed to know.
Session 2 ran in 33:23 wall time, finished every remaining story on the first attempt with one retry on S32 (the L5 DTO blast — more on that in a minute), and opened the pull request.
What could have been
Across both sessions, the sum of every story's solo execution time was ~143 minutes. That's what a single Claude Code session would have taken to do the same work in series — one story at a time, no parallelism.
Wall time across the two baro sessions was ~71 minutes of active work (the 11-hour real-world wall clock is the cap-induced sleep on top of that). So --parallel 3 bought a 2× speedup.
In the hypothetical where I had the headroom to run --parallel 31, the math is friendlier. The DAG floor is L0 + max(31 parallel) + L6:
L0 (S1, scaffold)       =  7:05
max middle story (S32)  = 16:11
L6 (S33)                =  7:59
                          ─────
                          31:15
Half an hour. That's the theoretical floor for this exact goal with this exact DAG, capped by the single slowest middle story. Below that you only go by splitting S32 into finer stories — which the Planner could have done if I'd nudged it.
4.6× speedup over sequential, capped by the single slowest story rather than by my plan tier. That's the chart that matters most to me, because it tells me where to push next: the Planner needs to be more aggressive about splitting anything that smells like S32.
Why "--parallel 31" is even a number you can ask for
Most multi-agent setups I've worked with have a coordinator at the centre — a Python orchestrator function, a LangGraph state machine, a CrewAI delegation tree. The coordinator owns the control flow. When you ask it to run 31 agents in parallel, the coordinator is the thing that has to be 31 things at once. In practice that means a thread pool plus shared mutable state plus a coordination protocol you wrote yourself, and somewhere in there is the bottleneck you can feel even when you're not looking for it.
baro doesn't have that shape, because Mozaik — the runtime baro is built on — doesn't have a coordinator. Every moving part is a participant on a shared event bus. The Conductor is a participant. The Planner is a participant. The Architect is a participant. The Librarian, the Sentry, the Critic, the Surgeon, the Finalizer — all participants. Each one subscribes to event types and emits events of its own. None of them call each other directly. There is no central run() that everyone reports to.
What "spawn 31 story agents in parallel" actually means in this run is: the Conductor emitted 31 StorySpawnRequestItem events onto the bus. The Story Factory picked each one up independently and produced a Claude Code subprocess wrapped in a Story Agent participant. From the moment those subprocesses started, the Conductor wasn't driving them. It was just another listener, waiting for StoryResultItem events to come back. 31 truly independent processes, 31 truly independent bus participants, no shared lock, no scheduler that has to wake up to feed the next agent its turn.
That's the architectural property that turns the "well obviously they're independent" assertion on the DAG into actual parallelism the OS would schedule on whatever cores are available, instead of a pseudo-parallelism choked by a Python GIL or an async def coordinator that can only attend to one agent at a time. I went into more detail on the bus pattern itself in the baro vs Claude Code post — the short version is that "adding a new behaviour" in Mozaik almost always means "add another participant", not "modify the orchestrator". Same property that made adding the Architect in 200 lines possible is the property that makes asking for 31 parallel agents a reasonable thing to do.
The cache did most of the work
Tokens are the other axis you stare at after a run like this. Pulling the totals out of baro's audit logs across both sessions:
- Fresh input tokens (uncached, paid full price): 1,295. Yes — one thousand two hundred ninety-five, across 72 Claude API calls. Read that twice.
- Output tokens (generated): ~481K.
- Cache creation tokens (first time a chunk gets cached, paid at 1.25× input price): ~2.34M.
- Cache read tokens (replays of already-cached chunks, paid at 0.1× input price): ~65.3M.
That ~65.3M cache-read figure is the one that makes multi-agent coding economically viable. The cache-creation to cache-read ratio is about 1 : 28 — each cached chunk gets re-read 28 times on average. Two reasons:
- Intra-story, every Claude Code turn re-sends the entire conversation. A single story does 20-50 turns of Read / Edit / Bash / think, and after the first turn the entire growing history flows through the cache. baro asks Claude Code to use the 1-hour ephemeral cache marker, so long stories like S32 (16 minutes) stay warm end-to-end.
- Cross-story, the orchestrator system prompt is shared. Every story spawns with the same baro-flavoured Claude Code system prompt and tool definitions. First story pays to cache it, the rest read it.
Rough cost math at current Anthropic Sonnet 4.7 rates (these are estimates from my own meter; do your own arithmetic for anything that matters):
~$178 saved on a single run by a feature I don't write any code for. baro just inherits prompt caching from Claude Code, which inherits it from the Anthropic API. The whole stack quietly leans on that 10× discount on cache reads, and a long multi-turn coding agent is the workload it was designed for.
L6 decided not to file any issues
This is the part I want to talk about most.
S33 — the L6 story — had a specific, opinionated brief. Run npm run test:cov. Validate the suite isn't garbage (no expect(true).toBe(true), no it.skip / xit / it.only, no @ts-ignore, no as any, no real DataSource / createConnection / HTTP / filesystem). Gate on ≥85% branch coverage. For every legit failing test, file a GitHub issue with file / line / expected / actual / repro / failing assertion.
Here is the relevant chunk of S33's commit message, verbatim:
Results after fix: Test Suites 64 passed / 64 total. Tests 808 passed / 808 total. Snapshots 0. Time ~9s. Coverage (jest --coverage, all files): 79.24% statements / 83.53% branches / 76.94% functions / 79.49% lines.
Bug triage: no test failed after the spec-side fix, so no production bugs surfaced and no GitHub issues filed. The one suite-load failure was confirmed test-side (missing virtual moduleNameMapper stub), not production.
Zero filed issues, because there were no real failures to file them for.
That's the whole reason the L6 story is shaped the way it is. If you don't put a quality gate at the end of a run like this, you get the worst of both worlds: an LLM that will absolutely generate expect(true).toBe(true) to pad coverage, and a coverage number that lies, and a bug-issue tray full of "tests" that fail for reasons that have nothing to do with production code. Quality goes down, noise goes up, and the maintainer ends up triaging more in a week than they would have written tests for in a month.
What you want from the gate is exactly what S33 delivered: if the suite is fine and the production code is fine, the gate says so and shuts up. If the suite is fine and the production code is broken, the gate files an issue with enough detail to fix it. Both outcomes are non-events from the maintainer's point of view. Which is the same as saying: the L6 phase pays for itself the day it correctly declines to do anything.
One detail worth flagging: S33 did find a single suite that wouldn't load — promotions/mappers/promotionResponse.mapper.spec.ts couldn't resolve the src/common baseUrl alias because of a transitive import from the test-utils. The S33 agent noticed that other mapper specs in the run had used the same jest.mock(...) virtual stub pattern, applied it, re-ran the suite, and only then reported coverage. That's the difference between a quality gate that actually validates the work and one that just reports the first failure to whoever asked.
What's still hard
The biggest single thing this run exposed is that one story can become a soft serial bottleneck if the Planner packs too much into it. S32 — the L5 DTO validation sweep — wrote 24 separate DTO spec files in a single story. It took 16:11. While it was running, the other parallel slots sat idle waiting for it to finish, because nothing else in the DAG was at that level.
In the parallel-31 theoretical chart above, S32 is the floor. To drop below 31 minutes, you'd have to split that story into something like six smaller DTO stories, one per module folder. The Planner already supports that shape — it just didn't reach for it here, because the goal happened to phrase the DTO sweep as a single line item. I'll be tightening the Planner prompt so that anything that smells like "validate N files" becomes N stories by default.
The other piece of work this run created for me is the error message Claude Code returned when the usage cap hit: claude reported isError on result:success. That's a string baro produces by stitching three different fields out of the Claude Code subprocess response and it's borderline gibberish. The next baro release will detect that specific shape and report it as Anthropic usage limit reached with a hint to wait until the reset window. Six story agents in a row producing the same opaque error in the middle of the night is the kind of UX bug you only notice when you actually use the thing.
Why this is the run worth writing about
I write a lot of these benchmark posts about baro competing with single Claude Code sessions on small, sharp refactors. Those posts have a clean head-to-head structure and a winner, and they're fun to write. This run isn't shaped like that.
This run is what baro is for. A real, boring, mechanical task — write unit tests for the parts of a NestJS service that didn't have any — that would take a senior engineer most of a working week and that no engineering manager ever quite has the runway to schedule. baro did it in 71 minutes of active work plus a night's sleep, for ~$36 of Anthropic spend, and handed me a pull request that I could read end-to-end over a coffee.
More importantly: it's the shape of work where the things that make baro good — a planner that can decompose, an Architect that pins design decisions, parallel story agents that don't step on each other, a quality gate at the end that refuses to generate phantom bugs — all compound on top of each other. You get the parallelism, you get the coherence, you get the discipline, all at the same time. None of those individually is novel any more. The interesting bet is on having all of them in one system that you can drive from one prompt.
Try it, read it
baro is on npm and GitHub. Mozaik — the event-bus runtime baro is built on top of — is at jigjoy-ai/mozaik.
The repo this run landed on is private, so I can't link you to the actual PR. What I can tell you is that the setup is reproducible end-to-end against any NestJS service you control that doesn't currently have a test suite: install baro, type the same goal, set --parallel to whatever your plan tier can sustain, walk away. If you end up where I ended up, you'll know within two minutes of opening the PR.
And if you do hit the usage cap at 3am — congratulations, you have an unusually clear permission slip to go to bed. Your run will be on the same branch in the morning, waiting for you to type the same command and finish what it started.
If you do run baro on something and it goes sideways — or it goes well and you want to show off the diff — come find us on the JigJoy Discord. That's where the people building baro and Mozaik hang out, and it's the fastest way to get a real answer about a weird DAG, a stuck story, or a run that's doing something we didn't predict.

Different is better than better.
Made with baro itself. 🤖
